


Table of contents
I have recently come across a wonderful Video on SQL Server performance tuning and troubleshooting checklist by Kevin Kline. and created the notes below for my reference.
Troubleshooting Checklist
Shortcut! Has anything changed?
Try to identify what has changed in the server. If there is an unexpected change, that means we are introducing risk into our application/server. To mitigate this issue, we shall create a SQL agent job that runs every day and checks the hash of the below system views and alert if the hash value changes.sys.configurationsorsp_configuresys.databasesDDL triggers for metadata changes
Inside or outside of SQL Server?
We want to see whether the problem is inside or outside of SQL Server.
Check the Windows application error log.
Check SQL Server Error Log and SQL Server Agent Log.
Is the issue caused by a SQL Server?
- Enable SQL Server Agent notifications for severity level 18 or greater.
Are there excessive wait stats?
sys.dm_wait_statsIt tells us where the SQL Server is encountering a bottleneck.
When SQL Server waits for something, it is reported as a wait type. Not all the wait types are bad.
Correlate wait stats against other metrics.
Import the PerfMon trace file into the SQL Server profiler to correlate the performance data along with the events.Follow-up
Tools to use:
Execution Plan
SQL Server Dynamic Management Views (DMVs)
SQL Server Profiler and Server-side traces
Extended Events
Wait Stats
Performance Monitor (PerfMon)
Scheduler and Wait stats:
Consider every CPU you have like a drive-through window at a fast food restaurant.
It can serve one person at a time. Many customers want different things. The person at the counter gets the request from you and goes back to the kitchen and brings you what you have requested.
1 window = 1 scheduler. Users are assigned to a thread.
The customer who is currently getting served has the status as
RUNNING. Once the request is made, the scheduler checks what type of lock is required. For example, if the request is toUPDATEa table, then it needs an exclusive lock. The scheduler checks whether an exclusive lock can be acquired or not. If not, the thread will have to wait. It will be inSUSPENDEDqueue. Meanwhile, the other customers behind theRUNNABLEqueue will move up and become aRUNNINGthread.All the other customers behind the line are having everything they need except for some time from the waiter at the counter. These threads are waiting for some time on the CPU. These threads will be in
RUNNABLEstatus.
Top 10 waits
CPU Pressure:
Parallelism - CXPACKET
CPU Pressure - SOS_SCHEDULER_YIELD
Locking:
Long-term blocking:
LCK_X
LCK_M_U
LCK_M_X
Memory:
Data cache latch - PAGELATCH_X
Non-data cache latch - LATCH_X
Query memory grants - RESOURCE_SEMAPHORE
I/O:
Buffer I/O latch - PAGEIOLATCH_X
Loading data from the I/O subsystem to memory is causing the wait.One reason could be we do not have enough memory. So it constantly has to buffer in and buffer out of memory.
The other reason could be the I/O subsystem is too slow.
Tran log disk subsystem
The transaction log is either on a subsystem that is too slow or it is getting bombarded by too much activity or maybe transactions that are not released fast enough like open transactions for too long. In these scenarios, we will get the below wait types.WRITELOG
LOGBUFFER
General I/O issues:
IO_COMPLETION
ASYNC_IO_COMPLETION
Network Pressure:
- Network I/O: ASYNC_NETWORK_IO
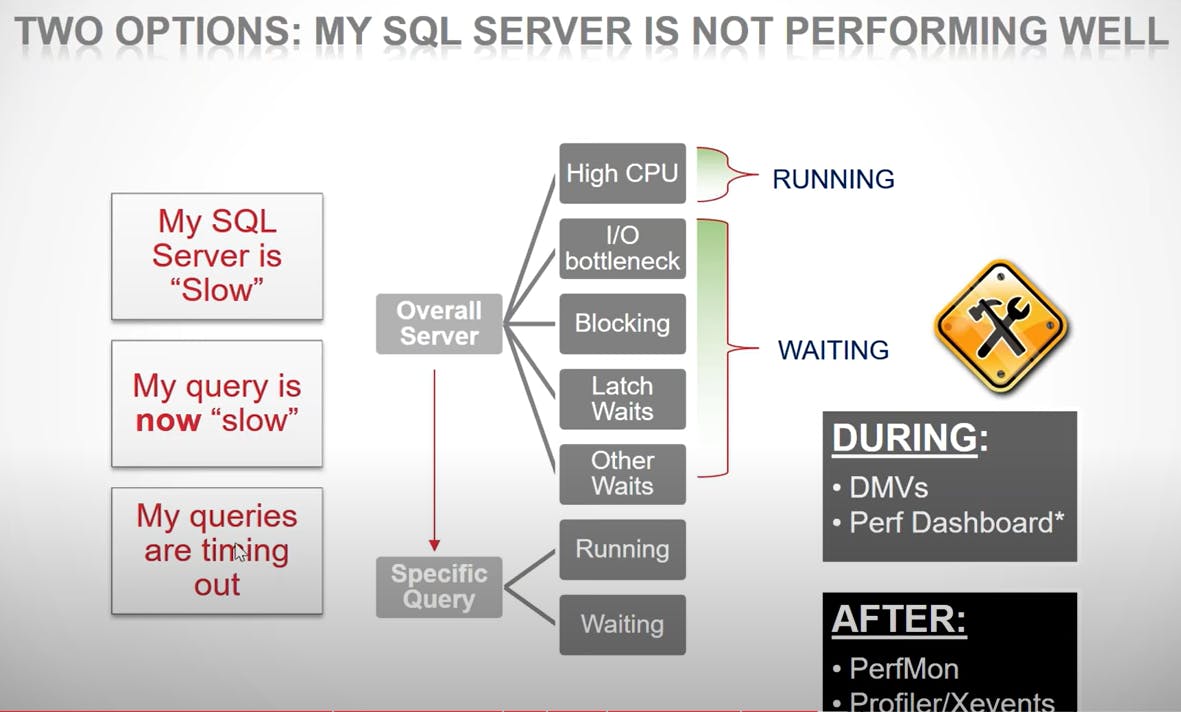
Perf Dashboard has a high overhead. Hence not recommended to use.
PerfMon
Benefits
Shows the rate of resource consumption or activity in a wide variety of areas on the server. For example
Disk IO: Memory; Network
SQL Server Activity: Locking, blocking, and deadlocking; Cache activity; Object utilization.
Limitations
Very hard to know what to track and what value indicates good or bad performance.
It does not offer good root-cause analysis, only resource consumption information.
Profiler or Extended Events
Monitor SQL Server for the occurrence of events.
When an event fires, the profiler logs the event and information about it.
It doesn't offer resource consumption info. It just provides granular detail. PerfMon should be used alongside the profiler when you troubleshoot a performance issue.
It is useful for
Finding and diagnosing slow-running code.
Capturing the series of SQL statements that lead to the problem.
Reproducing a problem in a lower environment. It is not recommended to use in a production environment.
Dynamic Management Views
Performance and Wait stats
sys.dm_os_wait_stats
sys.dm_os_performance_counters
sys.dm_os_waiting_tasks
Wait information.
Task level.
Very accurate.
Transient data.
I/O
sys.dm_io_virtual_file_stats
sys.dm_io_pending_io_requests
Transactions
sys.dm_tran_lock
sys.dm_db_index_operational_stats
sys.dm_db_index_usage_stats
SPID activity and SQL Statements
sys.dm_os_exec_requests
sys.dm_exec_requests
sys.dm_exec_query_stats
sys.dm_exec_procedure_stats
sys.dm_exec_trigger_stats
Resources:
sp_blitz by Bretn Ozar
Extended events articles by Jonathan Kehayias
DMV - Diagnostic queries by Glenn Berry
Troubleshooting SQL Server wait stats - Whitepaper
SQL Server Performance Tuning Using Wait Statistics. - Whitepaper
SQL Performance articles on wait stats